
Streamlined workflow for fitting, visualising and exporting publication-ready ELISA calibration curves
HUSTON, TX, UNITED STATES, August 25, 2026 /EINPresswire.com/ -- Enzyme-Linked Immunosorbent Assay (ELISA) remains one of the most widely-applied quantitative immunoassay techniques across global life-science laboratories. Reliable standard-curve fitting constitutes a critical step to convert optical-density readings into accurate analyte concentration values for ELISA datasets. GraphPad Prism integrates biostatistical calculation, curve-fitting and scientific plotting capabilities, making it a popular tool for processing ELISA results. Cloud-Clone presents a complete hands-on guide for researchers to build, adjust and export high-quality ELISA standard curves within GraphPad Prism.
Introduction to GraphPad Prism
GraphPad Prism is specialised software combining biostatistics, curve-fitting algorithms and scientific data visualisation. Designed for research-oriented workflows, it runs across multiple operating systems and is extensively utilised in biology, medical research and other scientific disciplines. This guide walks users through generating fitted ELISA standard curves with linear regression.
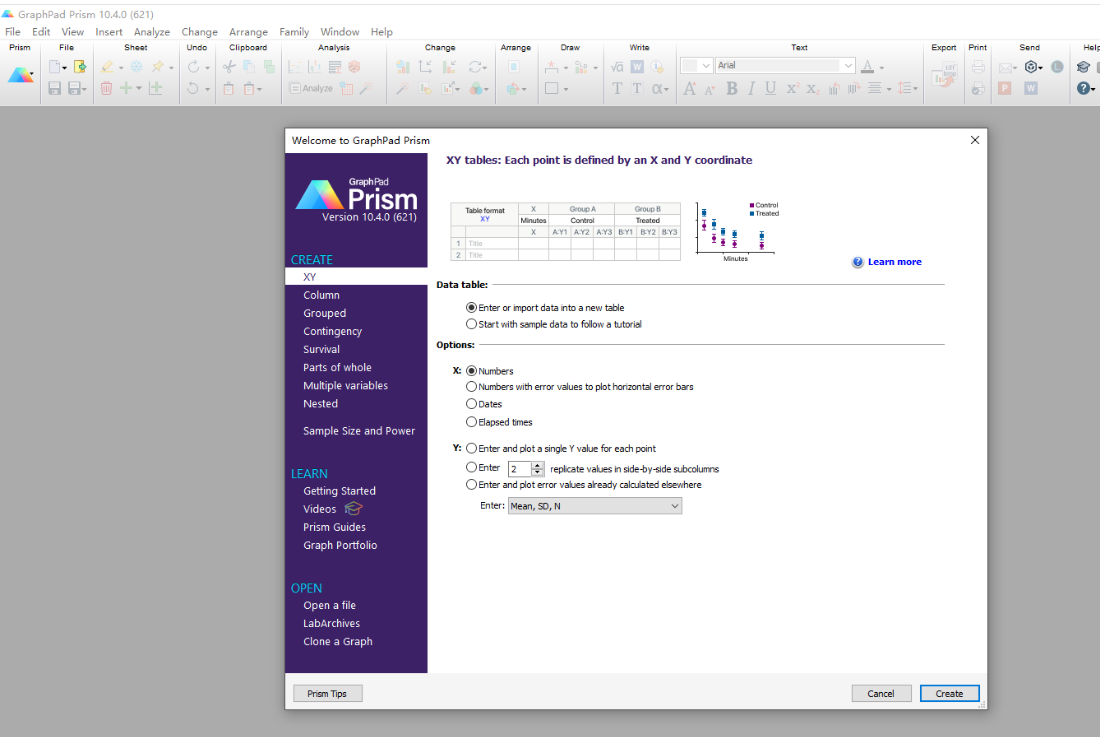
Figure 1 GraphPad Prism welcome startup interface
Step 1: Launch GraphPad Prism 10
Open the GraphPad Prism 10 application. On the welcome screen, select the XY table format, which is designed for datasets defined by paired X- and Y-coordinate values.
Figure 2
Step 2: Configure replicate-well settings
Define the number of Y-value replicates according to your experimental layout. Select 2 replicate values in side-by-side subcolumns for duplicate-well ELISA measurements. Choose the single-value entry option if you ran single wells only. Afterwards click Create.
Figure 3
Step 3: Import raw ELISA data
Navigate to Data 1 sheet. Paste your experimental data directly into the table. Assign X-axis values for standard-analyte concentrations and input corresponding optical-density readouts in Y-value columns for your standard-curve measurements.
Step 4: Configure graph display settings
Open Change Graph Type. Under Plot, select Mean and Error, and set error-bar calculation to SD (Standard Deviation). Confirm your selection by clicking OK.
Figure 4
Step 5: Access graph-editing workspace
You will now enter the graph-editing view, where plotted raw data points with error bars are displayed.
Figure 5
Step 6: Perform linear regression fitting
Click the Analyze button located in the top toolbar. Choose Simple Linear Regression for basic straight-line fitting. Retain default parameter settings and click OK to run the calculation. Alternative fitting models are also available within the analysis menu for non-linear ELISA datasets.
Figure 6
Step 7: Retrieve fitting-result metrics
After computation completes, navigate to the tabular-results output sheet. Key outputs including regression slope, intercept, R-squared (coefficient of determination), and the final fitted regression equation are displayed for your standard curve.
Figure 7
Step 8: Customise curve visual appearance
Click the fitted regression line to modify visual properties such as line style and colour. Enter the Format Axes dialogue to adjust axis limits, tick intervals, labels and scaling parameters for your plot.
Step 9: Refine layout and export final figure
Fine-tune colours, labels and overall visual layout for publication requirements. Right-click the finished graph to access export functions and save the output image file.
Figure 8
Summary
Generating reliable ELISA standard-curves in GraphPad Prism follows a clear workflow: creating an XY-format table, importing replicate standard-sample OD values, configuring mean-plus-SD visualisation, running regression analysis and customising plot aesthetics before export. Correct standard-curve fitting underpins trustworthy analyte-concentration calculation for ELISA experiments. Reproducible calibration curves support robust comparison across assay batches and strengthen the reliability of your immunoassay findings.
Closing Remarks
High-quality data visualisation and statistically sound curve fitting are essential components of immuno-assay research. Cloud-Clone provides matched ELISA assay kits together with technical guidance to support global researchers throughout assay execution and post-acquisition data processing. If you encounter challenges with ELISA standard-curve fitting or require technical support for immunoassay products, please reach out to Cloud-Clone for consultation.
About Cloud-Clone Corp.
Cloud-Clone Corp. is dedicated to the development and production of high-quality immunoassay reagents and detection solutions. With a focus on antibody engineering, multiplex assay development, and cross-platform compatibility, the company provides research tools designed to support precision medicine and advanced biomedical investigation globally. Our core products and services include the research and development of proteins, antibodies, ELISA kits, primary cells, and multiplex cytokine assay kits, as well as professional CRO services to fully meet the diverse needs of biomedical research and related fields.
For more information about Cloud-Clone Corp, visit www.cloud-clone.com.
CLOUD-CLONE CORP.(CCC)
Tel: 001-832-538-0970, 0086-27-8425-9552
Email: mail@cloud-clone.com, sales@cloud-clone.us
Visit us on social media:
LinkedIn: https://www.linkedin.com/company/cloud-clone-corp/
Instagram: https://www.instagram.com/cloudclonecorp2023/
TickTok: https://www.tiktok.com/@cloudclonecorp2026
SuKi Duan
CLOUD-CLONE CORP.WUHAN
Visit us on social media:
Legal Disclaimer:
EIN Presswire provides this news content "as is" without warranty of any kind. We do not accept any responsibility or liability for the accuracy, content, images, videos, licenses, completeness, legality, or reliability of the information contained in this article. If you have any complaints or copyright issues related to this article, kindly contact the author above.

Media gallery